If you are a regular reader of this newsletter, you may remember parts of the grain marketing article in our summer edition where corn acres and national yield were discussed. At that time, we were expecting planted corn acres to be about 95 million acres and a national yield of 181 bushels per acre.
This would have been the third highest corn acres planted in the last 50 years (trailing only 2012 and 2013) and the highest national yield ever, topping the record set last year of 179.3 bushels per acre.
USDA has updated those numbers a couple of times since then. Planted corn acres have increased to 98.7 million acres, the most we have planted in the United States since 1933. Yield has also been updated a couple of times since then.
The August supply and demand report estimated a national corn yield of 188.8 bushels per acre. The September report revised the expected yield significantly lower at 186.7 bushels per acre. Private estimates expect the national yield to continue falling to somewhere around 184-185 bushels per acre. While that is a significant reduction, it is more than offset by the huge increase in planted acres.
Historical Acres
While 98.7 million is a lot of corn acres, our highest corn acreage ever planted was 111 million in 1917. 1933 had 102 million acres of corn as part of the most acres ever planted to major crops at 301 million acres nationwide.
The interesting part of that amount is that only about 210,000 of those 301 million acres were planted to soybeans, as they were just beginning to be cultivated in the United States. Major crops in 1933 were corn, wheat, oats, and hay.
Soybeans
While planted corn acres have increased from our spring prediction, soybean acres have decreased. Expected acres of soybeans started out at roughly 83.5 million acres and has decreased to the current amount of 81 million acres.
Yield has also increased from our spring trendline prediction of 52.5 bushels per acre up to the current USDA projection of 53.5 bushels per acre. If achieved, this would also be a new record national yield from a per acre basis.
Corn & Soybean Prices
So, what will the price of corn and soybeans do if we achieve record yields as predicted? Usually this means prices will continue lower, but that is not what we have seen. Some market analysts believe we have made a long-term bottom in late summer or early fall. This does not mean they think prices will go significantly higher, just that they are not going any lower.
The long-term downtrends that started in the summer of 2022 look like they have reached their valley after 30 months. Here are some other factors that have contributed to the current bear market:
- Domestic livestock numbers are historically low, leading to less feed usage.
- China has been completely absent from our export markets.
- Delayed release of biofuels policy from federal agencies.
- Corn to ethanol conversion rate is at a record high at over 3 gallons per bushel.
- Retaliation by other countries for tariffs on their nonagricultural products.
Flat Corn & Soybean Markets
The calendar year 2025 corn and soybean markets have been some of the most difficult for sellers in multiple years.
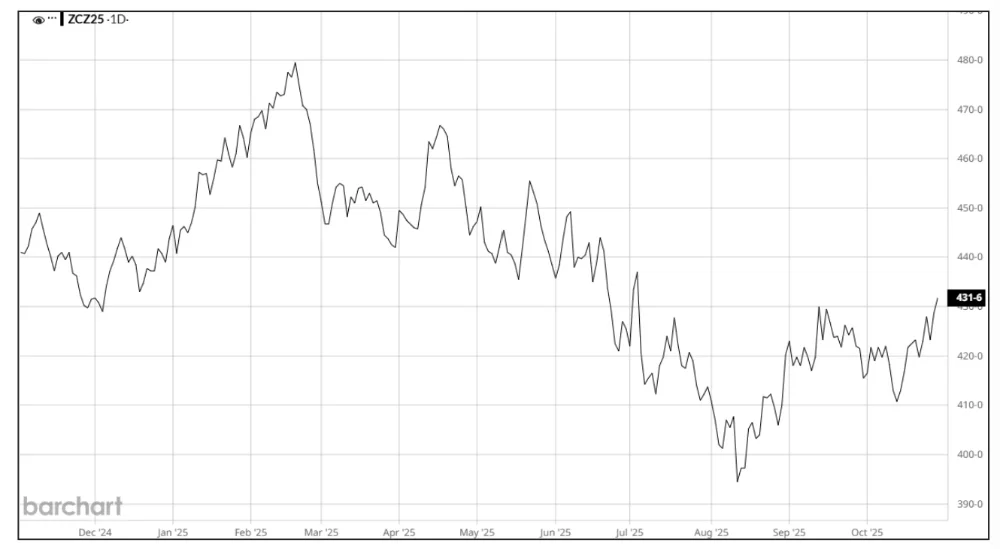
Corn Futures Graph
Corn peaked in mid-February and then mostly stair-stepped its way down to the pre-harvest lows on August 12th. While the range was wide at about 90 cents, it wasn’t overly volatile as it steadily went lower throughout the year.
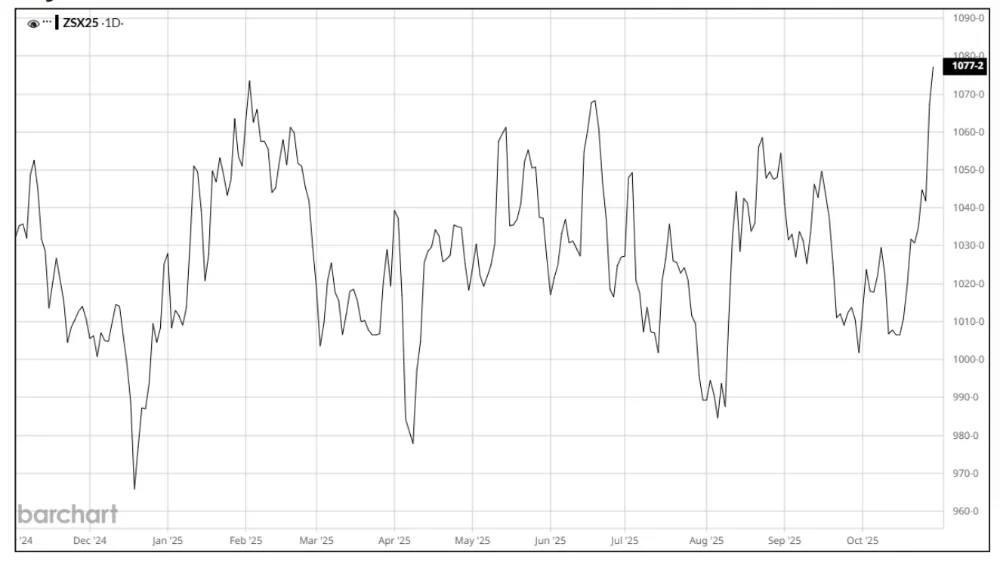
Soybean Futures Graph
Soybeans have been a completely different market to watch. The range of $1.00 per bushel has been fairly small compared to recent years, but it has been anything but boring. The soybean market peaked in early February and nearly returned to the same high in mid-June. Between and after those peaks the market was very volatile but stayed within the same $1.00 range.
Corn & Soybean Exports
Why are exports of corn and soybeans such a big deal? No matter what some of us would like to think, we are participating in a global market with our agricultural products. Our domestic supply is not the only important factor in price discovery. It is true that we are the largest single producer of corn in the world, and it is not particularly close, so when we say we only export 15-20% of our total crop, that is still a very large volume.
Because we grow and export such large volumes, any interruption can dramatically change our ending stocks and stock to use ratio. Our largest destinations for exported corn are Mexico, Japan, Colombia, South Korea, and Canada. China was a significant customer of our 2020-2021 crops but has cut back to less than 1% of our total exports last year.
Soybeans are much more dependent on exports. We can only use a certain number of bushels domestically and the rest are sent elsewhere. We have traditionally exported about half of our annual crop. Top destinations have been China, European Union, Mexico, Indonesia, and Egypt. In the 2010s, about 65% of our exports were to China.
The First Trade War
The first trade war saw the Chinese seek out other providers to fulfill their soybean needs and South America was very willing to step into that role. We have not gained all that business back and our most recent crop year (2024 crop) had China at roughly 50% of our total exports.
The Second Trade War
To date, the Chinese have made no purchases of our 2025 soybean crop, instead opting to increase purchases from Brazil and Argentina. Brazil continues to expand planted acres every year.
We are hopeful an emerging domestic use of our soybeans will be processing the soybeans locally and using the soybean oil to produce renewable diesel fuel. Renewable diesel has the potential to transform our domestic soybean market in the same way that ethanol changed the domestic corn market.
Renewable diesel has the potential to be even more dynamic than ethanol because it can be a 1:1 replacement for petroleum diesel without any blending as we must do with bio diesel and ethanol.
Keep your eyes on the 45Z Clean Fuel Production Tax Credit provisions and RVO (Renewable Volume Obligation) under the Renewable Fuels Standard for any new developments.
The One Big Beautiful Bill Act extended the 45Z credit through 2029. Soybean harvest is complete in Northwest Iowa and corn harvest is nearly done as well. Better than average yields, although maybe not record-setting, seems to be the story for most.
Our current commodity prices, coupled with extremely expensive inputs, will require above average yields to be profitable this year. Hopefully exports return and domestic usage improves to help us get through this difficult economic time in agriculture.
Partner With Stalcup
If you are looking for a partner to help with farm management, need a farm appraisal, or have other questions, give us a call or contact us using our online form. We would love to have a conversation with you.
