Farming comes with uncertainty every year, mostly involving factors like weather, markets, and crop pests. This 2025 season feels even more up in the air than usual. There are several unique factors at play this year concerning the global economy, weather, and domestic policy which may end up helping or hurting the farm economy. It’s too close to call at this point on so many levels.
Nevertheless, most farmers and landowners are optimistic that 2025 will turn out better than 2024. It’s in a farmer’s nature to be optimistic each spring, or else they should consider a different occupation.
From a farm profitability standpoint, we look to be in the second year of a downturn period similar to 2014 to 2019. The farm economy tends to be cyclical. The latest high profit periods peaked in 2008, 2013, and 2022. Each of these peaks was followed by a handful of downturn years.
The shifts in the cycle are spurred by a major change in demand like the ethanol boom in 2006-2008, a change in supply like the major drought in 2011-2012, or a major geopolitical event like the war in Ukraine in 2022.
According to the USDA, net farm incomes in 2024 were down 4.1% from 2023 and down 22.6% from the peak in 2022. History suggests we’ll have at least a few more years of lower profits before a bounce back higher.
No one knows for sure when or how the current cycle will unfold, but we look at history for clues and opportunities. Management decisions are more crucial during the downturn years because the opportunities can be short-lived.
Here’s a closer look at a few things to watch this year:
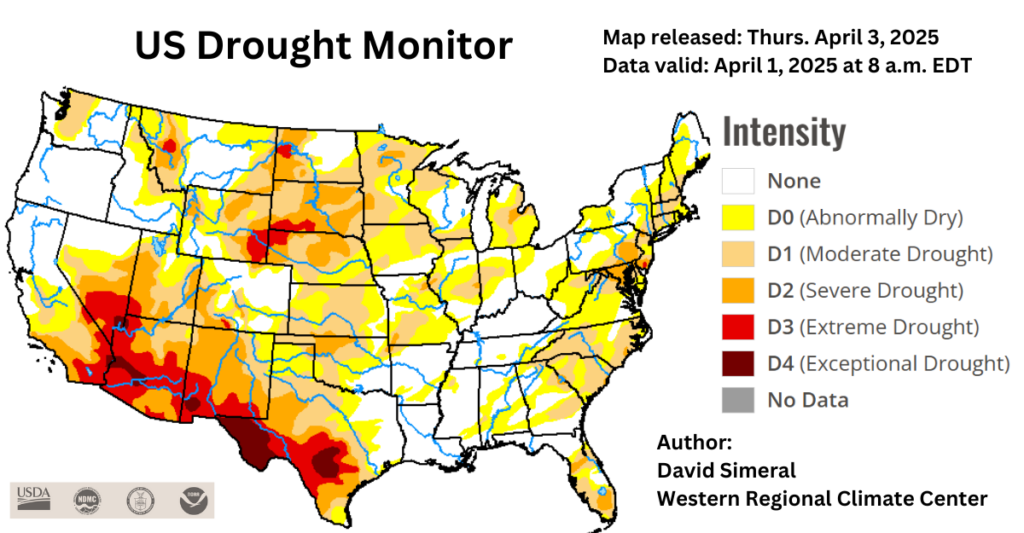
Drought Risk
The latest drought monitor is worse than last year for western Iowa, South Dakota, Nebraska and the surrounding Midwest states. Areas on the eastern side of the corn belt are also in multiple levels of drought like last year.
According to NOAA, 43% of the Midwest is Renewable Energy Production in moderate to severe drought, with an additional 25% abnormally dry. For what it’s worth, NOAA also predicts drought will persist this season in Iowa and areas to the west while areas to the east are expected to improve.
Before we get too nervous, keep in mind long-range seasonal forecasts are frequently wrong. The elevated drought risk we see now brings to mind the spring conditions in 2021, 2022, and 2023, so it’s a familiar situation.
The La Nina pattern we are in now is expected to continue through Spring and dissipate this summer. If that holds true, we could have a moderately dry start to the growing season followed by better rainfall later in the summer. That scenario could be very good for crops if temperatures are moderate.
The May and June droughts in recent years caused minimal crop damage compared to the July and August drought conditions. A warm and dry start to the growing season has advantages for planting and early crop development. We obviously need enough moisture to get the crop started, but excess rain in April, May, or June often does more harm than good.
Domestic Policy Tariffs
By the time you read this article, I’m hopeful the market is trading based on fundamentals instead of Trump tariffs. The markets don’t know what to do with the constantly changing trade policies involving tariffs.
Corn and soybean prices were trending higher early this year until tariffs were imposed on our biggest export customers—Canada, Mexico, and China. All the market gains for the year were erased in a little over a week.
Maybe the situation will be resolved quickly with Canada and Mexico, perhaps with a renegotiated USMCA trade agreement. However, a new trade agreement with China is unlikely anytime soon. Unfortunately, this could be the start of a long trade dispute.
That being said, it’s a global market and there’s only so much supply to go around the world.
The Renewable Fuel Standard (RFS)
This is a federal mandate to use a minimum amount of biofuels in the U.S. In 2023, the EPA set numbers through 2025 which included steady growth over the three years. However, oil refiners were allowed to buy RIN credits to get around the requirement. EPA will set the new RFS numbers late this year for 2026, we could see big changes, good or bad.
The Clean Fuels Production Tax Credit (45Z)
This encourages more types of renewable fuels like biodiesel, ethanol, and sustainable aviation fuel. It uses carbon intensity scores to calculate tax credits. The problem is with how these scores are calculated. Currently, imported fats and used cooking oils have a lower carbon score than U.S. grown corn or soybeans. This led to a big increase of imported oils.
There is an ongoing effort to help farmers improve carbon intensity scores of corn and soybean biofuels by using practices like cover cropping, minimum tillage, and enhanced efficiency fertilizer use. Tools for tracking and recording these carbon scores for farmers are still in the early stages.
Another possibility in the future to help carbon scores of biofuels is with permanent capture of carbon dioxide by injecting it deep underground through pipelines like the Summit Carbon Solutions project. The future of this entire topic is somewhat hazy considering the current political environment.
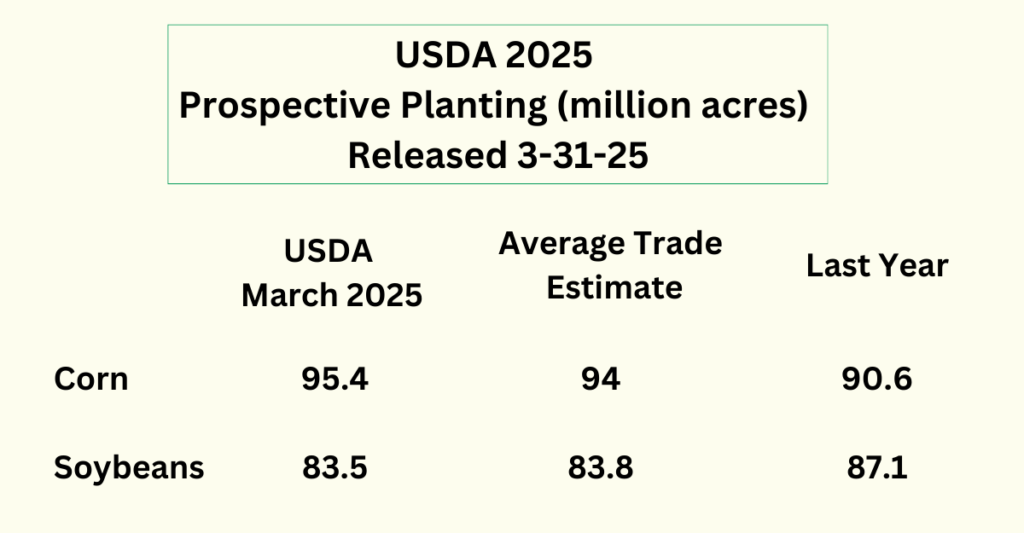
Supply & Demand Shifts
Corn Acres
U.S. corn acres are expected to increase significantly this year based on the economics of corn profitably compared to soybeans or wheat. Current forecasts anticipate around 95 million acres of corn will be planted this year. That’s up nearly 5 million acres from last year, and if the weather is somewhat favorable, it’ll be a record large crop over 15.5 billion bushels.
The corn demand is expected to be strong this year, so if that continues it will take a big crop to feed domestic usage and exports. Any weather issues reducing corn supply will be bullish to the market.
Soybean Crops
Soybean demand has been less impressive compared to corn, especially when it comes to exports. The South American soybean crop was the largest on record this year. Over the past decade, South American soybean production has boomed.
Brazil is now the world’s leading soybean producer and exporter, and they have become the primary source of soybeans for China.
The U.S. soybean acres are expected to be around 84 million acres, down 3.6 million acres from last year. The fewer acres will help, but we are still looking at ample supplies and relatively low prices this year. In the longer term, demand should continue to grow, improving prices, and the cycle continues.
Fertilizer Prices
The trade dispute between the United States and Canada is having a big impact on the price of potash. Canada is the world’s largest producer and exporter of potash (potassium) which is a significant part of fertilizer blends used by U.S. farmers.
Prices of other fertilizer components including phosphorus and nitrogen are heavily influenced by the political situations in China, Russia, and Ukraine. Those fertilizer prices are higher than a year ago and could go higher later this year. Historically, fertilizer prices tend to follow crop profitability trends, meaning low crop prices should eventually decrease fertilizer demand and in turn prices.
Most fertilizer products for this year’s crop were purchased last fall, so price volatility this year will probably have a bigger impact on the 2026 crop profitability than the 2025 crop.